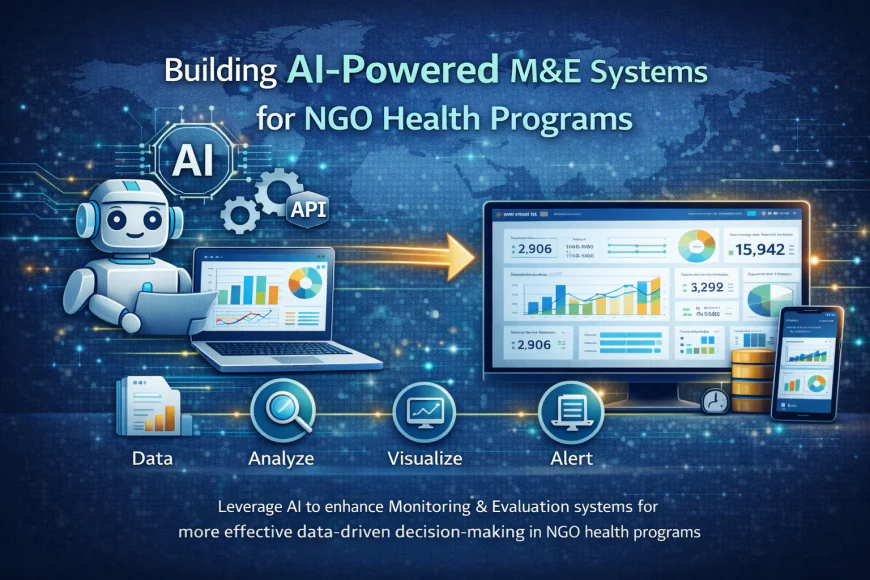
Building AI-Powered M&E Systems for NGO Health Programs
Design AI-powered monitoring and evaluation systems for NGO health programs. Combine ChatGPT for report generation, Google Sheets for data management, and dashboards for real-time M&E insights.
Building AI-Powered M&E Systems: A Practical Guide for NGO Health Programs
Overview
If you've been working in NGO health programs for any length of time, you know how overwhelming data collection and reporting can become. Teams struggle to track indicators, stakeholders wait for reports that take weeks to compile, and important insights get buried in spreadsheets. The gap between data collection and actionable insight is where most programs fail.
This is exactly the problem that AI-powered Monitoring & Evaluation (M&E) systems solve. By combining KoboToolbox for data collection, Google Sheets for data management, and AI tools like ChatGPT for analysis and reporting, you can build a system that delivers real-time insights to decision-makers.
Why AI for M&E?
M&E is fundamentally about answering questions: Are we on track? What's working? What needs adjustment? Traditional M&E approaches rely on manual data aggregation followed by analyst-written reports. This process is slow, error-prone, and delays decision-making by weeks or months.
AI changes this equation. Once your data pipeline is set up, AI can:
- Instantly summarize performance against targets
- Flag anomalies that warrant investigation
- Generate narrative reports without human writing time
- Surface patterns across geographic regions, program areas, or implementation periods
- Produce stakeholder-ready reports in minutes instead of weeks
The Real-World Scenario
Let's say you're an NGO running maternal health programs across 15 health facilities in Kenya. Monthly, you need to report on KHIS indicators (ANC attendances, facility deliveries, maternal complications) to MOH, plus custom indicators to your donors (counseling sessions completed, referral quality, staff retention).
Traditionally: Data comes from health workers via forms → collected in Excel → verified manually → someone writes a narrative → back-and-forth edits → finally submitted 2-3 weeks late.
With an AI-powered M&E system: KoboToolbox auto-syncs to Google Sheets → formulas validate and summarize → ChatGPT generates narrative → you review and submit within 2 days.
Building Your System
1. Data Collection Layer: KoboToolbox
Start with KoboToolbox because it's what health workers actually use in the field. Set it up to capture:
- Facility identifiers (facility name, district, zone)
- Indicator data (numerators and denominators for each KPI)
- Qualitative observations (what challenges were encountered, successes noted)
- Timestamps and geotagging for verification
Key: Design your forms to auto-calculate ratios where possible. This reduces math errors downstream.
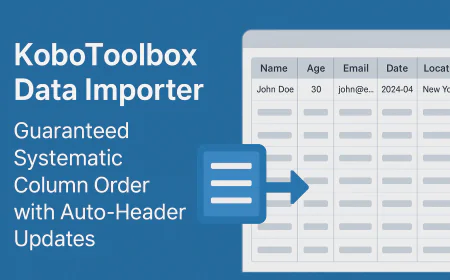
2. Data Management Layer: Google Sheets + Apps Script
When KoboToolbox data syncs to Sheets, don't just dump raw data. Structure it:
- Raw data sheet (unchanging copy of KoboToolbox exports)
- Cleaned data sheet (removes test entries, standardizes dates, fills missing geo-codes)
- Indicator calculation sheet (applies your formulae to get final KPI values)
- Dashboard sheet (summary tables for stakeholder reports)
Use Apps Script to automate this pipeline. Specifically:
- A scheduled function that syncs new KoboToolbox data daily
- Validation rules that flag outliers (e.g., a facility reporting 500 ANC attendances when typical is 30)
- Auto-population of analysis sheets
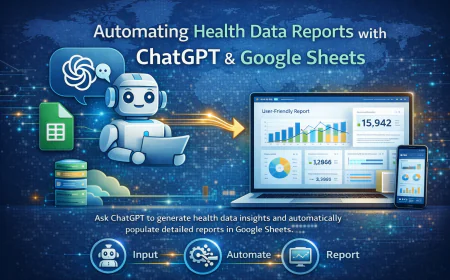
3. Insight Generation: ChatGPT Integration
Once your Sheets structure is solid, integrate ChatGPT via Apps Script to generate narrative insights.
Simple example: Your script reads monthly summary from Sheets and sends to ChatGPT:
"Generate a monthly performance summary for January 2025 for a maternal health program operating in Nyanza Region. We had 8,420 ANC visits (98% of target), 1,240 facility deliveries (94% of target), but only 2 maternal complications referred (target was 15, likely a reporting issue). Staff retention dropped to 85% from previous 92%. What does this data tell us?"
ChatGPT returns a paragraph like: "Facility delivery performance remains strong with 94% target achievement. ANC coverage is stable at 98%. The sharp drop in reported maternal complications suggests a potential data quality issue—health workers may not be systematically documenting complications. Recommend urgent clarification with facilities. The 7-point drop in staff retention is concerning and warrants immediate follow-up to understand turnover drivers."
You then copy-paste this into your report template. Done.
4. Reporting Layer: Structured Templates
Create a standard template that includes:
- Executive summary (from ChatGPT)
- Key metrics table (from Dashboard sheet)
- Facility-level breakdown (for accountability)
- Challenges and recommendations (ChatGPT-generated)
- Appendix with raw data for auditors
Frequency: Generate reports monthly or quarterly depending on your donor and MOH requirements.
Real Challenges You'll Face
Data Quality
Garbage in, garbage out. No amount of AI can fix fundamentally bad data. Before automating, spend time with health workers:
- Walk through data entry with 2-3 facilities
- Understand which metrics are hard to capture
- Identify which fields are always empty
- Adjust your forms accordingly
AI Hallucinations
ChatGPT sometimes invents facts. Always fact-check AI-generated insights against your actual data before sharing with stakeholders. Build in a review step where your M&E team reads everything before it goes out.
Internet Connectivity
In remote areas, KoboToolbox sync might be unreliable. Plan for offline data entry and occasional sync windows. Google Sheets formulas still work offline, so AI-generation can happen in batches.
Stakeholder Familiarity
Donors and MOH staff may be skeptical of AI-generated reports. Introduce gradually. Start with AI summaries as supporting documents, not the primary report. As stakeholders see the quality and consistency, adoption grows.
Steps to Implementation
Month 1: Setup
- Design your KoboToolbox forms
- Pilot with 2-3 facilities
- Collect 2 weeks of data
- Validate data quality
Month 2: Automate
- Build Google Sheets structure
- Write Apps Script for daily sync
- Test end-to-end pipeline
- Do a mock report generation
Month 3: Scale
- Roll out KoboToolbox to all facilities
- Integrate ChatGPT for report generation
- Train M&E team on system
- Generate first production report
Month 4+: Optimize
- Monitor data quality
- Refine ChatGPT prompts based on stakeholder feedback
- Add additional indicators or facilities
- Document SOPs for sustainability
Why This Approach Works
You're not replacing human judgment. You're automating the tedious parts (data entry, verification, write-ups) so your team can focus on the interesting parts (analysis, interpretation, strategy). Stakeholders get better reports faster. Your team works less on admin and more on insights.
The investment is modest: KoboToolbox is free, Google Sheets and Apps Script are free if your NGO has Google Workspace, ChatGPT is $20/month. Total: maybe $20-30/month for a system serving 20+ facilities.
By next year, you'll wonder how you ever did M&E without it.
What's Your Reaction?
 Like
0
Like
0
 Dislike
0
Dislike
0
 Love
0
Love
0
 Funny
0
Funny
0
 Wow
0
Wow
0
 Sad
0
Sad
0
 Angry
0
Angry
0


Comments (0)